- Pivot & Flow
- Posts
- August 2nd Market Overview
Happy Friday everyone… breathe the weekend is here!
What a freaky week of earnings, FOMC, and general debauchery of volatility in the markets. It’s weeks like this that stress out a lot of investors and traders. It’s important to look at bigger snapshots and longer time frames…this was just one week of action and the world is not ending.
Lets dig in…
Executive Summary
Markets Tanks: The S&P 500 suffered its worst session in almost two years, triggered by a disappointing jobs report.
Tech Sector Correction: The Nasdaq plunged into a technical correction territory, falling over 10% from its recent peak.
Recession Fears Intensify: Weak economic data sparked concerns about a potential economic downturn, typical volatility around election time imo.
Market Overview
Today, we witnessed a significant sell-off in the markets. The S&P 500 dropped 2.1%, marking its largest decline since December 2022. The Dow fell 785 points (nearly 2%), while the Nasdaq Composite lost almost 2.6%, entering correction territory.
Key Market Drivers
Weak Job Growth: July’s job additions of 114,000 fell far short of the expected 185,000.
Rising Unemployment: The unemployment rate increased to 4.3%, reaching its highest level since October 2021.
Rate Cut Speculation: Market participants and general consensus believe the Federal Reserve should have cut rates at its recent meeting.
Stock Spotlight
Amazon (AMZN)
Amazon’s stock tumbled over 9.5% following a disappointing Q3 outlook. The company now expects Q4 revenue between $154 billion and $158.5 billion, below analyst expectations.
Intel (INTC)
Intel shares crashed nearly 27%, heading for their worst day ever. The company issued weak guidance and announced plans to cut 15,000 jobs.
Chevron (CVX)
Chevron’s stock declined more than 3% due to missed earnings and delays in its Hess Corporation acquisition.
Other Magnificent 7 Updates
Nvidia (NVDA)
Nvidia shares fell over 4%, extending the previous day’s big loss, amid concerns about AI-related capital expenditures.
Other Notable Company News
Sun Country (SNCY)
Sun Country’s shares rose about 1% after announcing a shift towards more freight flying for Amazon, expected to improve earnings.
Exxon Mobil (XOM)
Despite beating Q2 profit expectations, Exxon Mobil shares dipped slightly in premarket trading.
Sector Watch
Sector | Symbol | % Change |
|---|---|---|
Consumer Discretionary | XLY | -4.9% |
Consumer Staples | XLP | +0.25% |
Energy | XLE | -2.42% |
Financials | XLF | -2.81% |
Healthcare | XLV | -0.81% |
Industrials | XLI | -2.6% |
Materials | XLB | -2.42% |
Real Estate | XLRE | -0.34% |
Technology | XLK | -2.09% |
Communication Services | XLC | -2.28% |
Utilities | XLU | -0.81% |
Bond Market
The 10-year Treasury yield dropped to its lowest level since December as investors sought safety in bonds. This move reflects growing concerns that the Federal Reserve may have erred by maintaining current interest rates.
Policy Watch
Following today’s jobs report, the probability of a 50 basis point cut in the Federal Reserve’s benchmark overnight lending rate at its mid-September meeting has surged to 61.5%, up from just 22% yesterday. What this means to me -
Rate Cut Probability: The chances of a significant interest rate cut at the Fed's mid-September meeting have dramatically increased.
What Changed: Before today, there was only a 22% chance of a 0.5 percentage point rate cut. Now, that probability has jumped to 61.5%.
Why This Matters: Lower interest rates generally stimulate economic growth by making borrowing cheaper for businesses and consumers. The market's reaction suggests investors believe the economy needs this boost sooner rather than later.
What to Watch: Keep an eye on upcoming economic data. If we see more weak reports, it could further increase the likelihood of rate cuts, potentially impacting both stocks and bonds.
This shift in expectations underscores how quickly the economic outlook can change and how sensitive the market is to new information.
Today’s Sponsor is my book on swing trading!
If you want to take a more technical approach to swing trading and managing risk check out My book.
I spent a good bit of time on it and even included some charts with commentary and examples of setups I look for!
Here is a snippet from My book:
Holy Grail
Pattern 2: The "holy grail" pattern
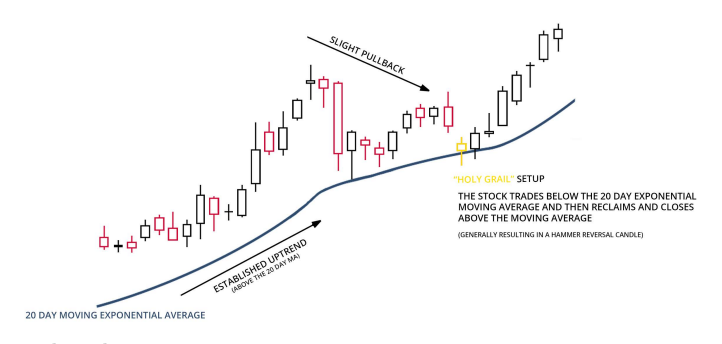
The Holy Grail Setup This technique capitalizes on strongly trending stocks that pullback and hold support at the 20-day moving average (MA). After consolidating at the 20-day MA, the stock often bounces and resumes its uptrend. The setup was first popularized by Linda Raschke and centers on buying dips in uptrends.
Here is how I trade it:
Key Criteria
Find stocks in strong uptrends that are overextended short-term
Wait for a "smart pullback" to the 20-day EMA
This is ideally the first or second test of the 20-day after a powerful earnings gap
The pullback should be steady, low volume, and take place over multiple days
How to Trade ItIdentify extended stocks and mark the 20-day EMA on the chart
Wait patiently for a low volume pullback and test of 20-day EMA
Enter long on the first sign of support and reversal at the 20-day
Use a stop under recent swing lows, below the pullback
Target a move back to recent highs as minimum upside target
Manage the trade with a trailing stop under 20-day EMA In summary, this high probability setup capitalizes on orderly, low volume pullbacks in strong uptrends by buying the first dip to the 20-day MA. This allows getting long at an ideal entry point with defined risk and upside targets. The pattern looks like this: The setup calls for a buying on the first or second test of the 20-day moving avg. in an strong uptrend. Ideally the uptrend started from a huge earnings or great news catalyst.
Note: This newsletter is intended for informational purposes only.